Share:
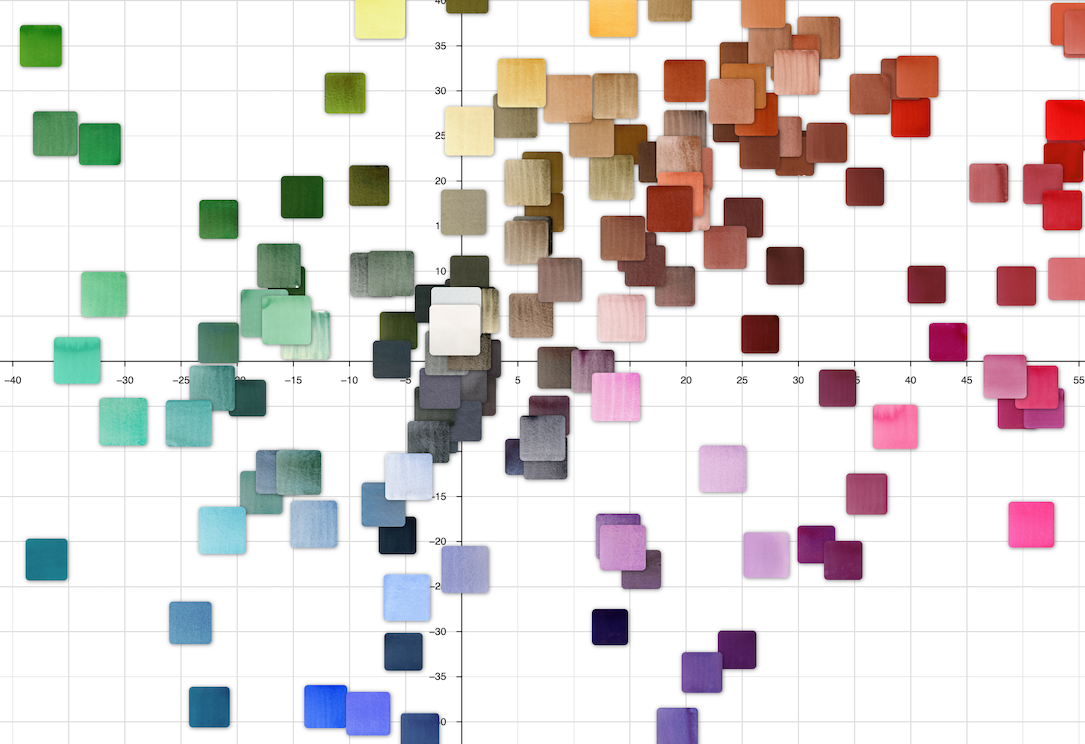
We’ve added some exciting NEW features to our Interactive Color Map (CIE Lab) which features 217* of the DANIEL SMITH Extra Fine™ Watercolors plotted in place.
CIE-Lab is a color space that was defined in 1976 by the International Commission on Illumination (abbreviated CIE for its name in French), which is the international authority on light, illumination and color. CIE-Lab expresses each color as having three values, which are plotted in a 3-D sphere along 3 axises: “L” is the vertical axis for perceptual lightness (colors at the top of the axis are lightest, colors at the bottom are darkest) and the “a” and “b” axises divide the map into four quadrants representing the four color categories of human vision: red, green, blue and yellow. CIE-Lab is useful in a variety of industries (such as paint manufacturing) for detecting and documenting subtle differences in color. Click here to read more about its role in the study of color.
How to use the Interactive Color Map
The video tutorial below illustrates the map on a desktop or laptop computer screen. We hope you’ll find our Color Map helpful when choosing colors and discovering how various pigment characteristics work together and impact your artwork.
Join us LIVE on Thursdays via Zoom and/or Facebook to ask questions and learn more about the world of color!
* We did not include the colors from our Luminescent line, because their unique reflective and refractive qualities would overtake the intended hues, forcing all these colors to land together in the center of the map with the whites.
Click here to download the written script for this video.


